Graphing Project
Over the course of the trimester, the students tracked data of their choice. One student tracked attendance, while another tracked the temperature. The students worked responsibly to collect accurate data for over a month. At the end of the month, the students put their data in Microsoft Excel and learned how to showcase their data using different graphs. They also learned how to take their data and use it in different ways. For example the student who tracked attendance could figure out the weekly absentee rate and the daily rate. Below are their final projects. Enjoy!
Corynn - temperature
Ean - attendance
Maura - number of books read
Hallie - Hours slept
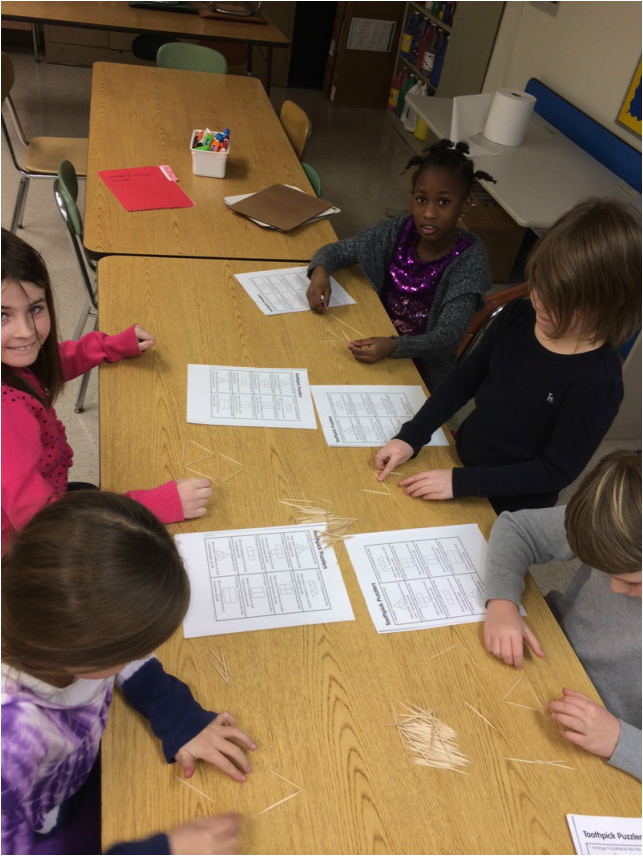
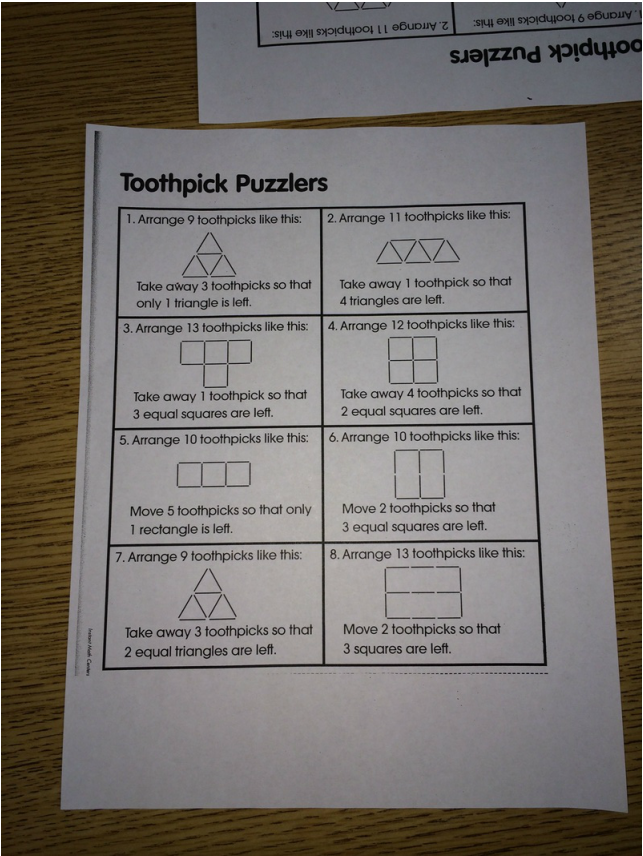
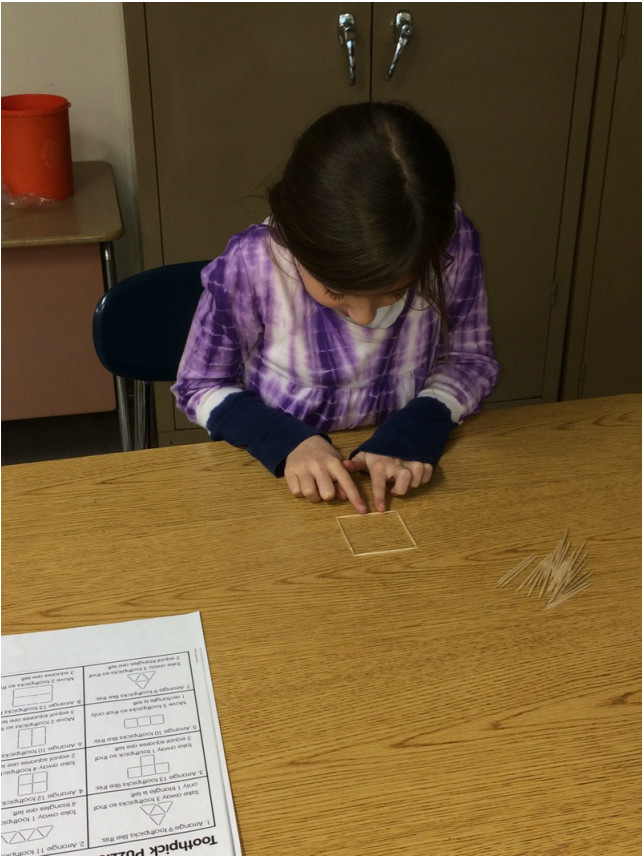
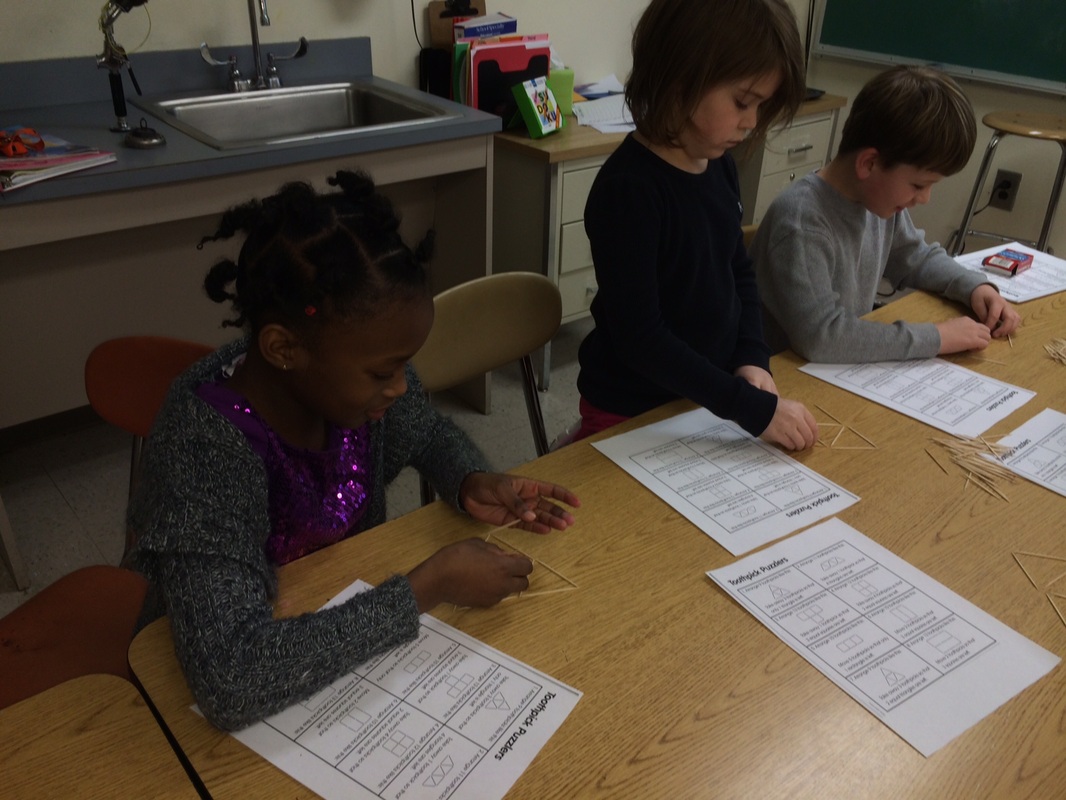
Logic
Students in third grade put their mathematical thinking to the test with some logic activities! Here they are doing some toothpick puzzles!